For this bootcamp project, my team developed Movie Recommendation Systems using both Collaborative Filtering and Content-Based Filtering techniques. Collaborative Filtering uses user-movie rating data to suggest movies based on similar user preferences, while Content-Based Filtering recommends movies based on genres, overviews, titles, etc.

Key technologies used in the project include:
The project featured a large-scale data transformation step where I:

Movie recommendation system demo in action
In my data analytics bootcamp, I was part of a project that analyzed Bitcoin's historical price movements to provide insights into market trends and volatility. Through visualizations, it aims to help readers understand Bitcoin's price behavior over time.
To achieve this, we used several technologies, including:
Data sources include CoinMarketCap for historical Bitcoin prices and Fidelity for ETF data.
The dashboard features several key visualizations:
The first two charts are controlled by two sets of buttons, allowing over 14 visualization combinations based on selections.

I generated a GIF using Python that fills the Bitcoin logo.


Chart plotting Bitcoin and Bitcoin ETF price changes
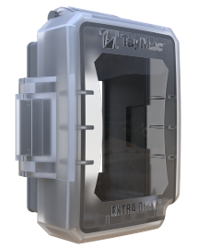
I led the design, build, and launch of the OPRTR case for the Samsung Galaxy Tab Active 5. This case is designed for operators requiring an adaptable mounting solution in various environments, including vehicle dashboards, chest molle mounts, and kneeboard mounts.
Key highlights of the project include:

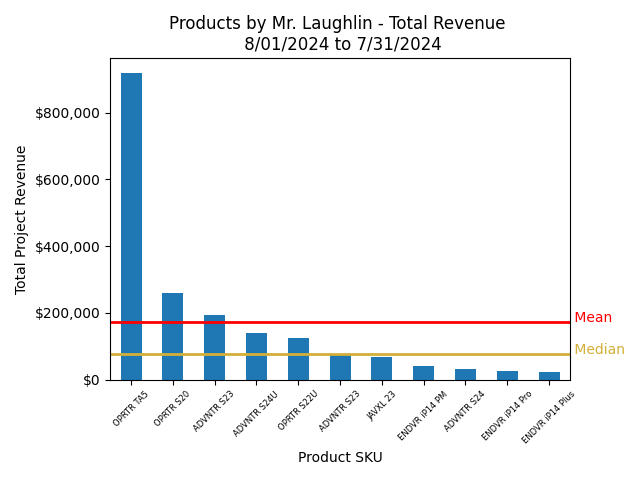
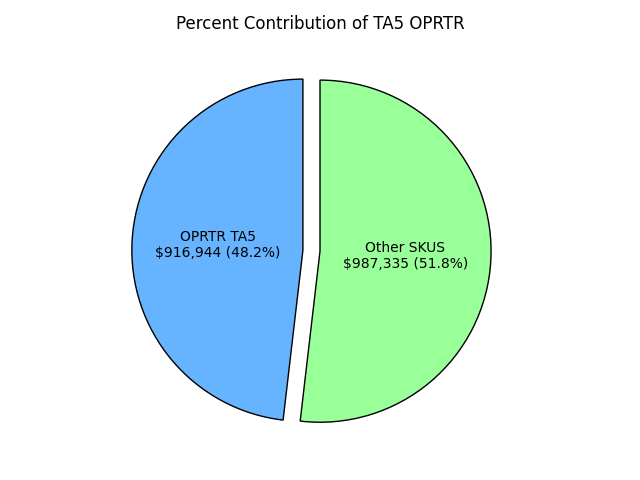
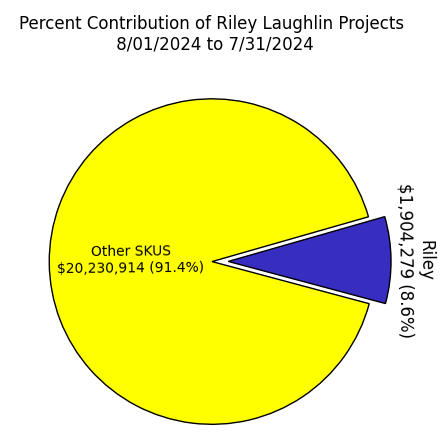
This chart shows the financial performance of my projects at Juggernaut.Case. The TA5 OPRTR was the highest-earning SKU among my project SKUs during my tenure, showcasing its market impact.

Juggernaut.Case designed ruggedized cases, mounts, and cables for military operators. During my time at Juggernaut, I was in charge of the design and launch of 10+ SKUs. Many of the skills I developed in design engineering translate to data analysis and business intelligence, including proficiency in various technological tools, strong project management capabilities, and effective collaboration within cross-functional teams.


In addition to my design projects, I also worked on various automation macros during my time at Juggernaut. This macro-based spreadsheet automates key processes in managing Creo Parametric files and inventory data imports, improving efficiency and accuracy. Below is a list of included macros and their functions.

Screenshot of the macro-based spreadsheet
Upon joining Juggernaut, I identified an opportunity to enhance Juggernaut’s approach to product data and lifecycle management. Processes were often dependent on Google Sheets, leading to inefficiencies. As part of our ECN process, data was entered in multiple locations manually. To streamline this workflow, I developed a VBA-based script that extracted data from an ECN spreadsheet and converted it into an importable CSV file for Fishbowl Inventory Management. This significantly reduced data entry time and improved process efficiency.
The automated process provided several key benefits:
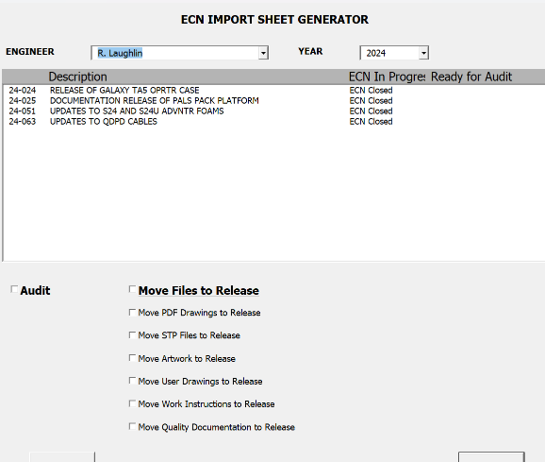
Custom userform to select a specific ECN.
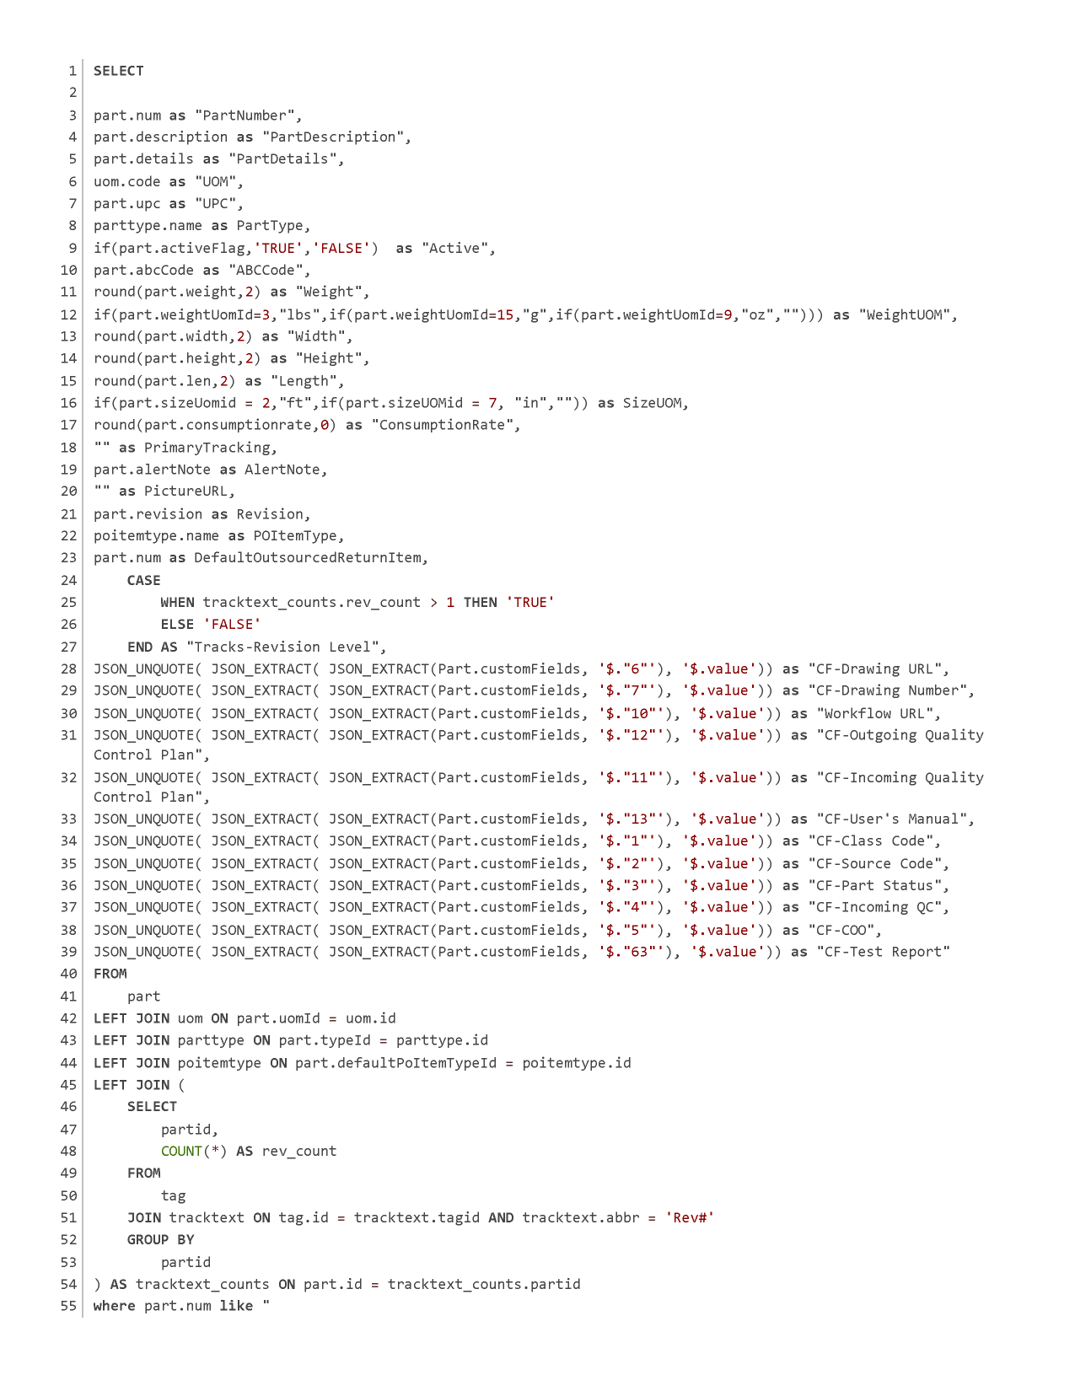
SQL code to query the Fishbowl management system on existing part numbers.
The Quality Tracking Spreadsheet utilizes the 8D (Eight Disciplines) Methodology for structured problem-solving and quality improvement. This system tracks, analyzes, and resolves issues to enhance product quality and prevent recurrence.
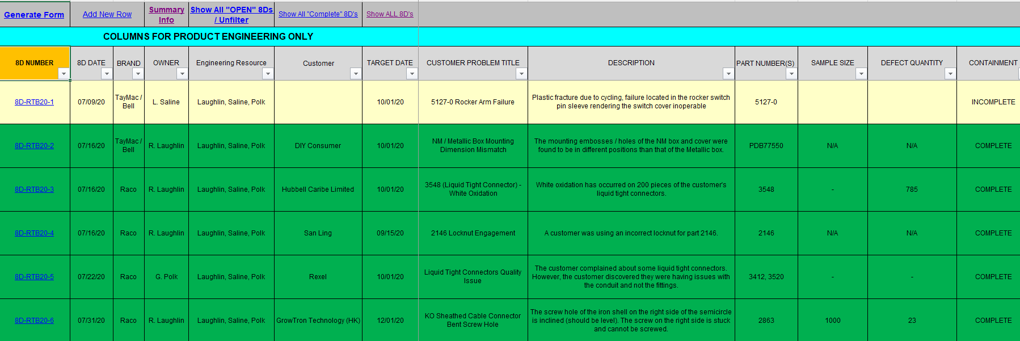
Initial view of the quality log
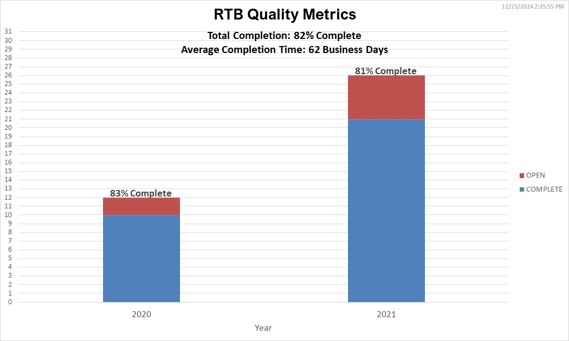
Chart detailing open vs. closed issues
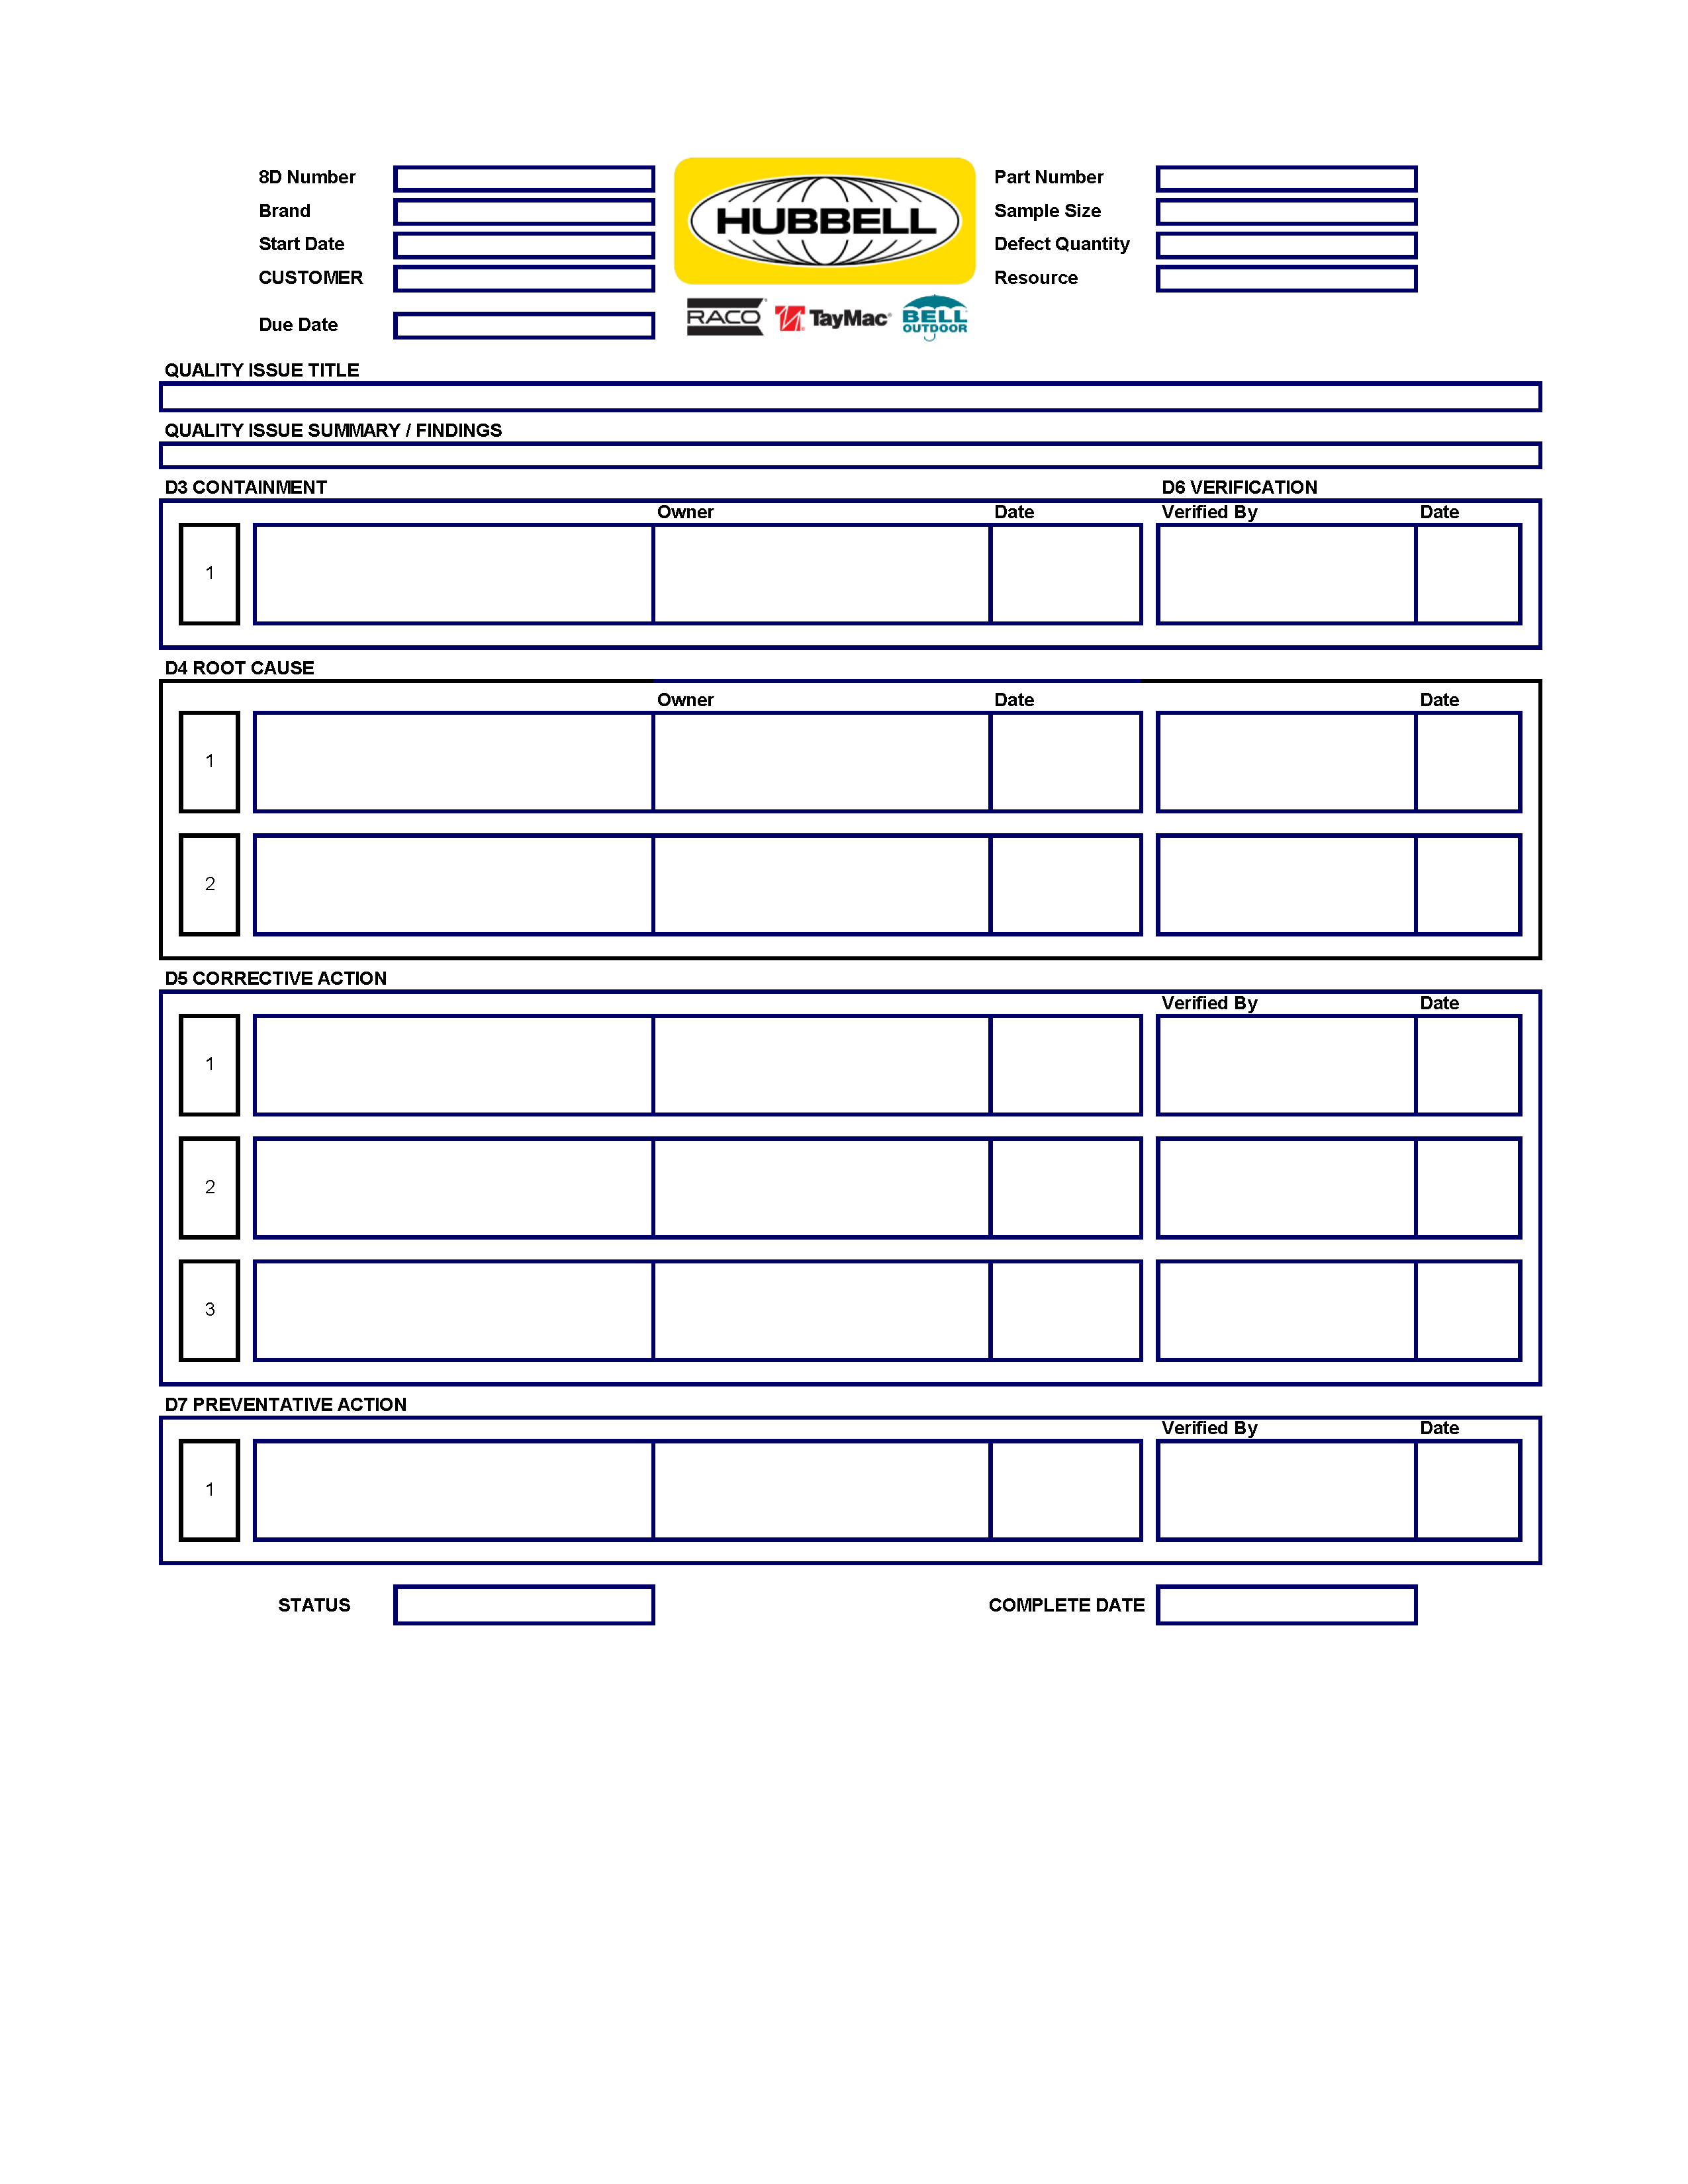
Final 8D Form
This bootcamp project analyzes New York's Citi Bike program data over a three-month period (Nov 2024 - Jan 2025), uncovering key insights into ride distribution, peak usage, and station popularity. Interactive visualizations were created in Tableau to highlight rider behavior and trends.


Screenshot of Citi Bike analysis story
This bootcamp project was developed to provide an interactive visualization of earthquake data collected by the United States Geological Survey (USGS). Using Leaflet.js, earthquake events are mapped based on real-time data, with visual indicators such as marker size and color representing earthquake magnitude and depth.

Screenshot of the interactive earthquake map
This bootcamp project analyzes natural disasters datasets, providing insights into the locations, frequency, and costs of such events. The analysis explores whether the frequency of natural disasters has increased over time using data visualization techniques.


Rising Disaster Counts: The frequency of natural disasters, especially floods and storms, has increased over time.
High-Impact Regions: Brady, Texas, experienced the highest frequency of disasters from 1960–2018.
Cost vs. Duration: There is no significant correlation between disaster duration and economic impact.
Major Events: Hurricane Katrina incurred the highest economic cost ($200 billion), while Hurricane Maria had the highest death toll (2,981).
This research paper analyzes the impact of concussions in the NFL, the evolution of rules aimed at player safety, and the broader societal consequences of traumatic brain injuries. Despite advancements in equipment and rule changes, concussions remain a prevalent issue in professional football.

Data for the number of concussions in the NFL was limited when I wrote this thesis.

Updated chart to reflect latest concussion data.

Deterioration of brain cells due to concussions

History of football helmets, including the Guardian Cap. The NFL first mandated the use of Guardian Caps during the early portion of training camp in 2022. The NFL began allowing Guardian Caps in games during the 2024 season. The Guardian Cap is a soft-shell pad that attaches to the outside of a football helmet to reduce the impact of blows to the head.
High Impact Speeds: Concussed players experience head impacts at an average of 20.8 mph, with head acceleration forces reaching 98 g’s.
Frequent Head Collisions: Approximately 60% of NFL collisions are head-to-head, contributing to high concussion rates.
Helmet Effectiveness: Virginia Tech research suggests modern helmets reduce concussion risks by 45-96%, though concussions remain common.
Player Health Concerns: Over the past decade, multiple former NFL players with a history of concussions have committed suicide, highlighting mental health risks.
This bootcamp project is an interactive dashboard that explores the Belly Button Biodiversity dataset, cataloging microbial species found in human navels. Using D3.js and Plotly.js, the dashboard provides insights into microbial diversity, showing the most prevalent and rare species across individuals.

The interactive biodiversity dashboard in action
This macro-based spreadsheet automates key processes in managing Creo Parametric files and inventory data imports, improving efficiency and accuracy. Below is a list of included macros and their functions.
Throughout my career, I have contributed to various mechanical design projects that involved concept development, prototyping, and product launch. Many of these experiences align with data analysis and business intelligence, as they required a systematic approach to problem-solving, leveraging data for decision-making, and optimizing processes for efficiency.

The Two-Gang Extender with Swing Arms improves ease of device installation. Patent Link


Weatherproof products concepts designed at Hubbell

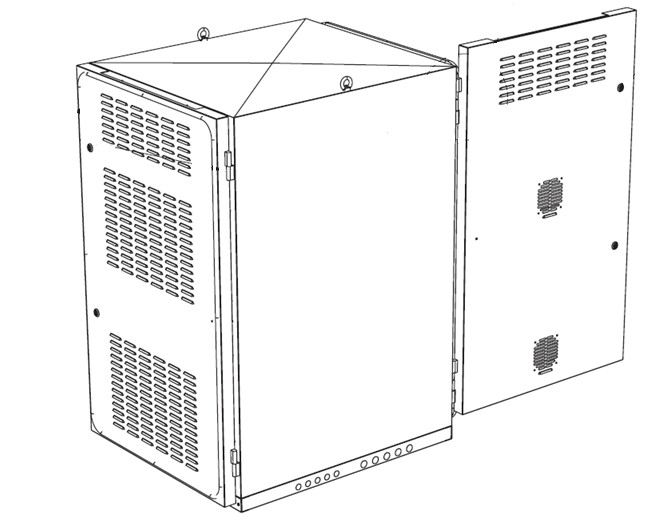
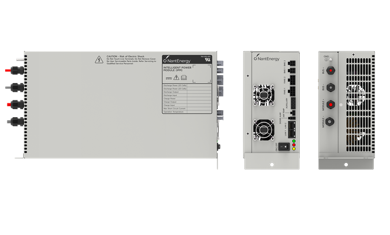


I designed injection molded parts and sheet metal cabinets/enclosures during my time at Fluidic.
This project involves building an Extract, Transform, Load (ETL) pipeline to process crowdfunding data. Using Python tools such as pandas, dictionary methods, and regular expressions, the data is extracted, transformed, and loaded into a PostgreSQL database.
Key Features:
Technologies Used:
The final outputs include CSV files, a PostgreSQL database schema, and SQL queries for data validation.

Entity Relationship Diagram (ERD) showcasing database structure
The purpose of this analysis was to generate a machine learning model to classify credit loans as Healthy or High Risk of Defaulting. Financial information such as loan size, interest rate, income, debt-to-income, number of accounts, and derogatory marks were used as evaluation criteria.
Key steps in the machine learning process included:
Confusion Matrix

Classification Report
Macro Avg: Precision (0.92), Recall (0.97), F1-score (0.94)
Weighted Avg: Precision (0.99), Recall (0.99), F1-score (0.99)
The logistic regression model performed exceptionally well with an accuracy of 99%. It correctly classifies 94% of all high-risk loans, which is an impressive recall rate. However, its High-Risk precision score is 84%, meaning some healthy loans may be misclassified as high-risk.
This model is suitable for deployment if recall is prioritized over precision. If minimizing the risk of approving high-risk loans is the goal, this model is a strong candidate. However, alternative models should be explored if false positives (misclassifying healthy loans) are a concern.
This project explores the impact of 24-hour and 7-day price changes on cryptocurrency clustering using unsupervised learning techniques. The objective is to determine whether cryptocurrencies can be grouped based on their price fluctuations using K-Means and PCA.
crypto_market_data.csv, then standardized features using StandardScaler().

Charts showcasing K-Means clustering before and after PCA.
The objective of this analysis was to develop a neural network model that predicts the success of applicants funded by the charitable organization Alphabet Soup. The model evaluates organizations based on various features such as application type, affiliation, classification, use case, organization, status, income amount, special considerations, and requested funding amount. Identification fields like EIN and name were removed as they did not contribute to prediction accuracy.
The neural network model consisted of an input layer based on the preprocessed dataset, followed by two hidden layers with 16 and 8 neurons, respectively, both using the ReLU activation function. The output layer contained a single neuron with a sigmoid activation function. The model was compiled using binary cross-entropy as the loss function, Adam as the optimizer, and accuracy as the evaluation metric.
The deep learning model demonstrated predictive capabilities, but alternative models such as Support Vector Machines (SVM), Random Forest, or K-Nearest Neighbors (KNN) may be explored for improved classification performance.
Several optimization attempts were made to improve performance. Adjustments included modifying the number of neurons in hidden layers, experimenting with additional hidden layers, testing alternative activation functions like tanh and swish, trying different optimizers, and varying the number of epochs to balance underfitting and overfitting. Despite these efforts, accuracy remained stable at around 72%.